
The following is a guest blog written by Ihor Uksta, iDalko Software Developer.
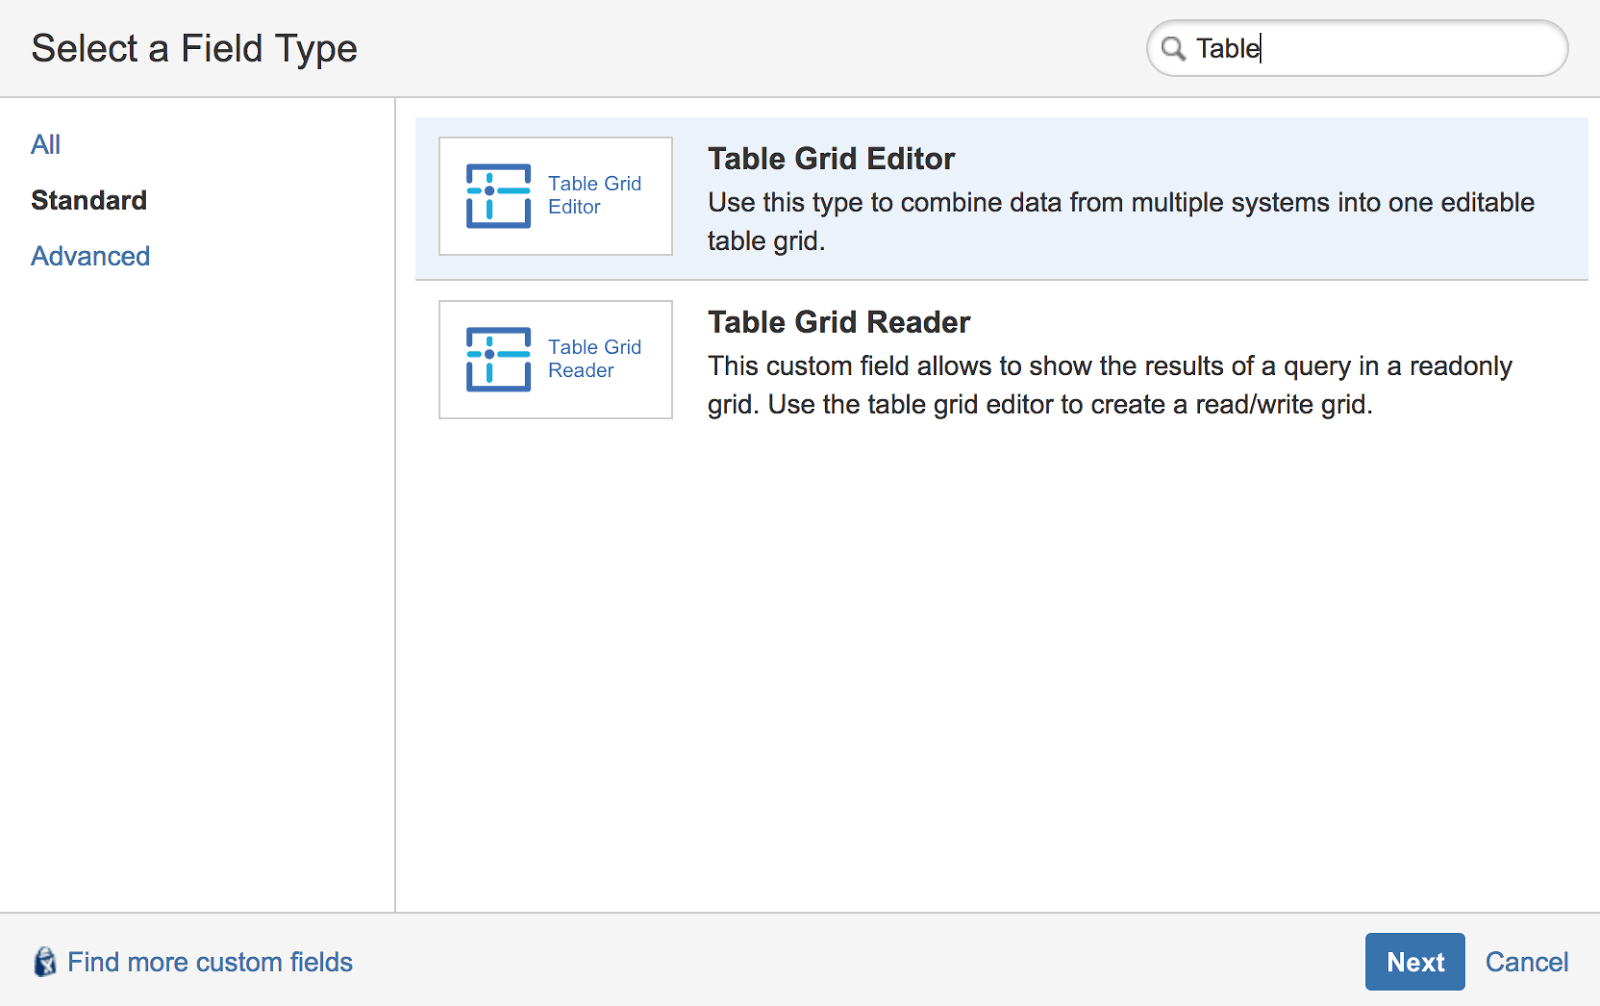
Table Grid Editor is a Jira add-on that allows you to view and edit tabular data, stored in local or external database, from within your Jira issues. It is an app developed by iDalko, an Atlassian Platinum Solution Partner based in Belgium.
Team reporting is very much needed by all Project Managers, Team Leads, and Scrum Masters. While Jira has a reporting tool, it only offers very basic functionality. Many Jira users prefer to use Xporter because it gives them the ability to define what they want to get printed and how it should be printed in the reports.
Let’s say you need to collect your team’s time-tracking information in a single Jira issue. In this case, it should be limited to a certain time period and depicted for a particular developer from your team. Ideally, you want this in tabular form. Aside from the time, you might store a rate for each developer, so you can calculate the total fee based on time spent for a corresponding period and rate per hour. An effective solution for this is the Table Grid Editor for Jira. Integrating this with the Xporter app allows for incredibly easy and intuitive reporting.
In this blog post, I’ll guide you through a demonstration of a use case for integrating Jira’s Table Grid Editor with Xporter.
Create a custom database table
Firstly, let’s create a custom table inside Jira to store the rate per hour for developers. We’re going to use the Table Grid Editor app for this.
We’ll have to start by using the Driving Tables feature of the Table Grid Editor. It allows you to create custom tables and store them inside the Jira database (or some separate one).
To create the table, go to the Driving Tables Admin page and click Add Driving Table.
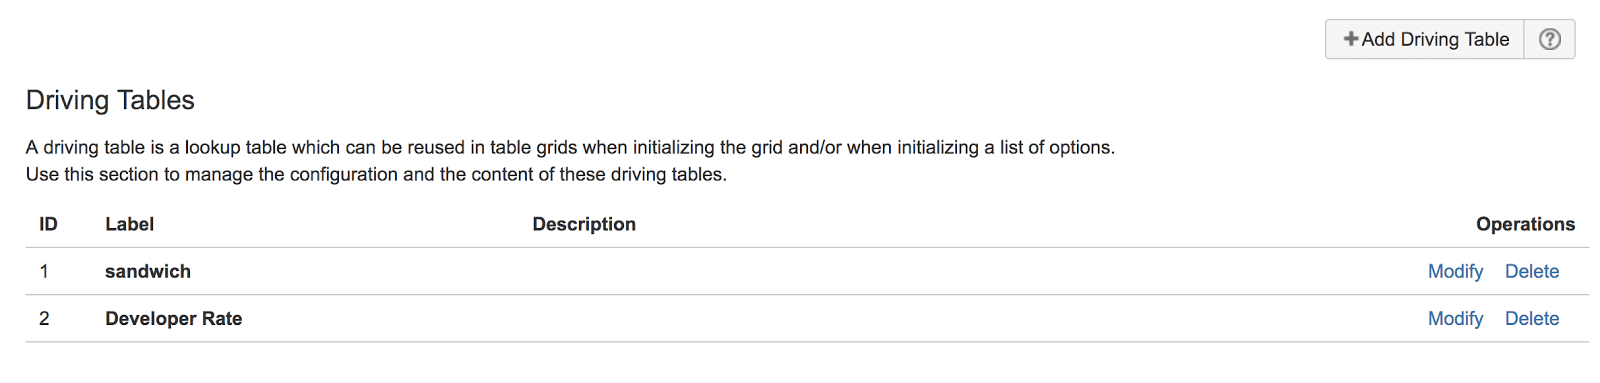
Assign a label for the driving table. We’ll call it “Developer Rate”. This is the configuration:
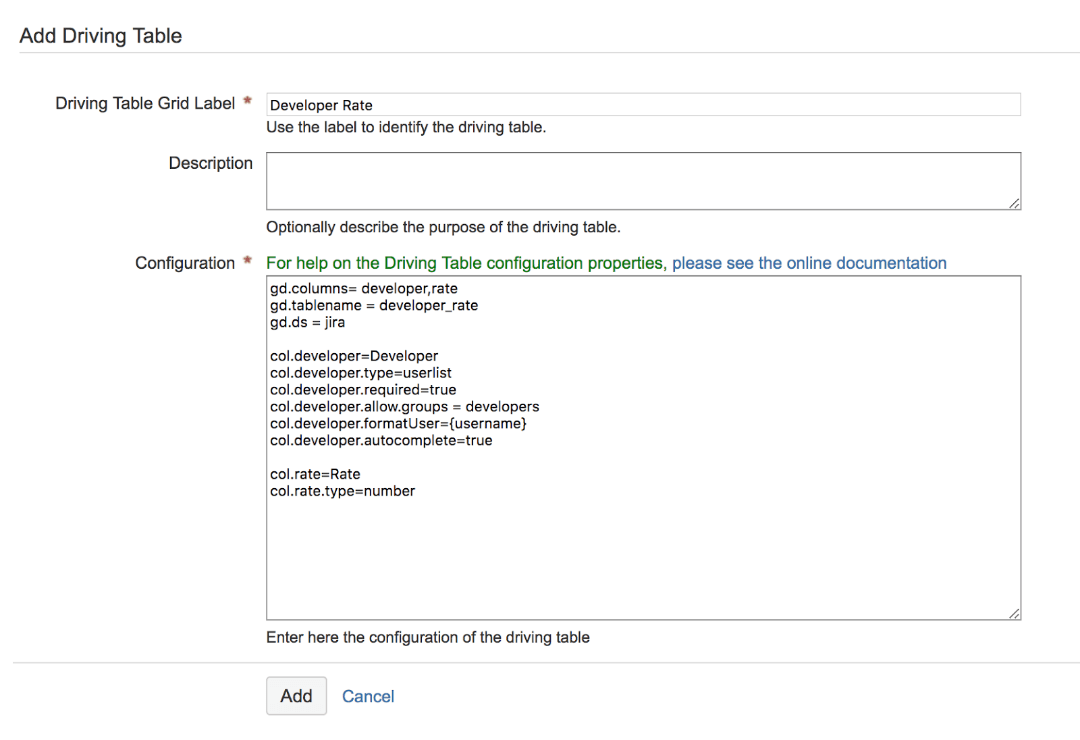
It is a key-value list of properties:
- gd.columns – where the column is described.
- gd.tablename – the name of the table. It will also have a suffix ‘_d’ plus the sequence number of the driving table.
- gd.ds – the datasource of your table; in our case, it’s jira (i.e., the database of your Jira instance).
For the first column, we’ll define the type ‘userlist’. It means that all your Jira users will be listed in a column. Afterwards, we can limit them to only one group ‘developers’, and set it as ‘required’ when inserting a row to the table.
All available properties are found here.
gd.columns= developer,rate
gd.tablename = developer_rate
gd.ds = jiracol.developer=Developer
col.developer.type=userlist
col.developer.required=true
col.developer.allow.roles = developers
col.developer.formatUser={username}
col.developer.autocomplete=truecol.rate=Rate
col.rate.type=number
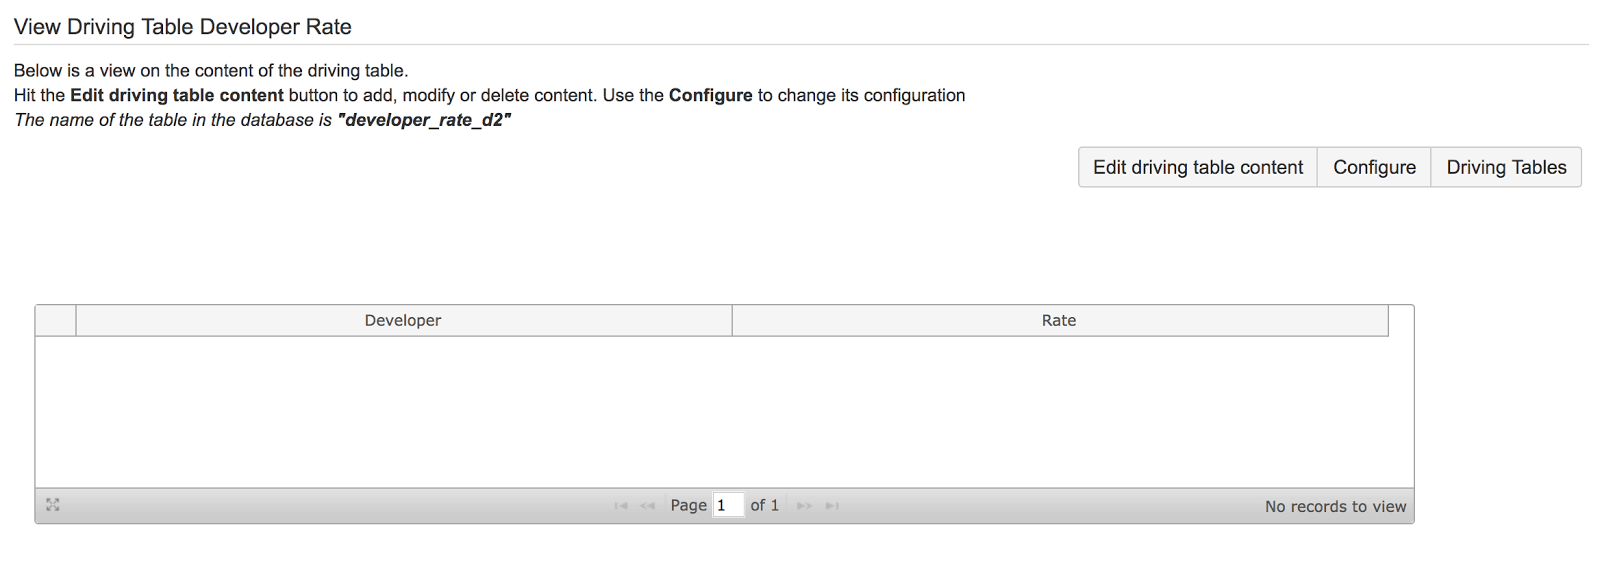
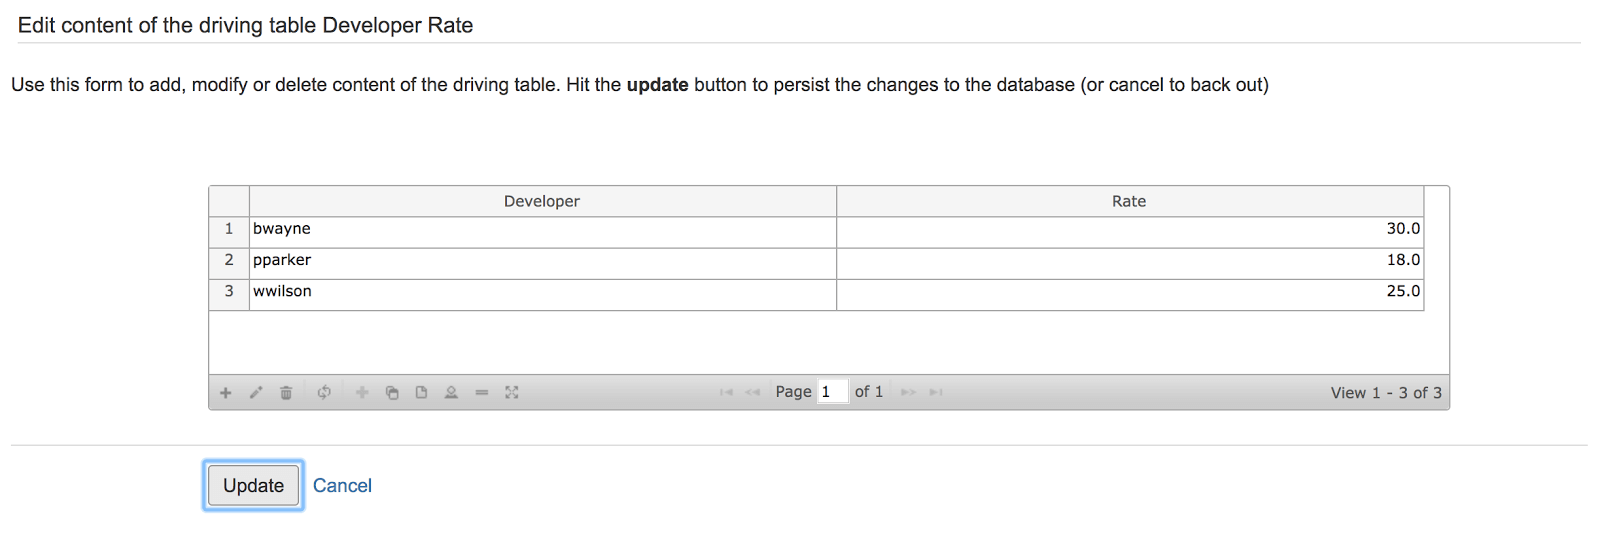
Now, it’s time to insert some data.
Go to your Developer Rate driving table and press Edit driving table content.

Now, let’s go to the Custom Fields page to create our Table Grid Editor field.
In the field configuration, click on Edit Default Value.
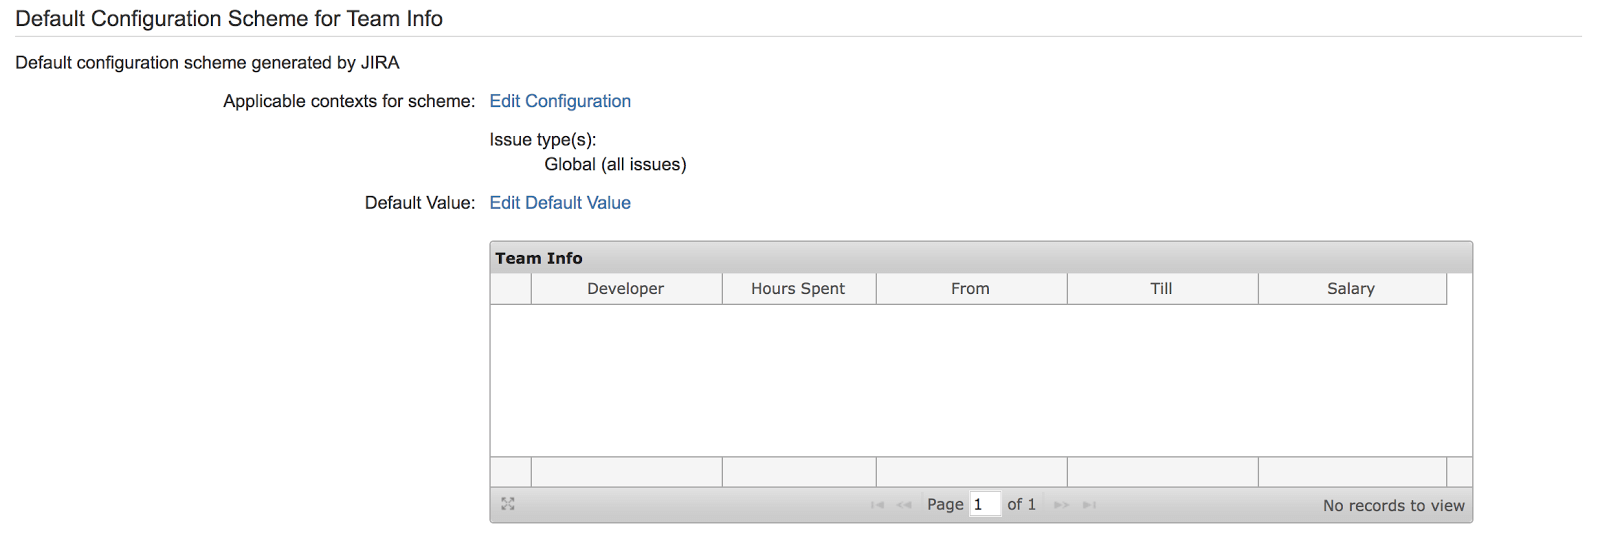
Then, add the following configuration:
gd.columns=developer,totalhours,startdate,enddate,salary
gd.tablename=teaminfo
gd.ds=jiracol.developer=Developer
col.developer.type=userlist
col.developer.required=true
col.developer.allow.groups = developers
col.developer.formatUser={username}
col.developer.autocomplete=true
col.developer.width=150col.totalhours=Hours Spent
col.totalhours.type = number
col.totalhours.formula = queries:value('jira', "SELECT timeworked FROM worklog where created >=  '" + {startdate} + "' and updated <= '" + {enddate} + "' and author = '" +{developer} + "'") / 3600
col.totalhours.width= 120
col.totalhours.formatNumber = #.## h
col.totalhours.summary = sumcol.startdate=From
col.startdate.type=date
col.startdate.defaultDate = -1wcol.enddate=Till
col.enddate.type=date
col.enddate.defaultDate = +1dcol.salary=Salary
col.salary.type= number
col.salary.formatNumber = #.## $
col.salary.formula = queries:value('jira', "SELECT rate FROM developer_rate_d2 where developer = '" + {developer} + "'") * {totalhours}
col.salary.summary = sum
In here, we used the same userlist with new formulas.
Inside the formula, we wrote an SQL query to the JIRA worklog database table to get all working hours for a selected developer and time scope.
To get the salary, we made a query to our developer_rate_d2 table. The result will be multiplied by the total hours.
We’ve also added a summary property for the ‘totalhours’ and ‘salary’ columns to display total results in the table footer. Avg, min, max, and count operations are available as well.
More examples of formulas can be found here.
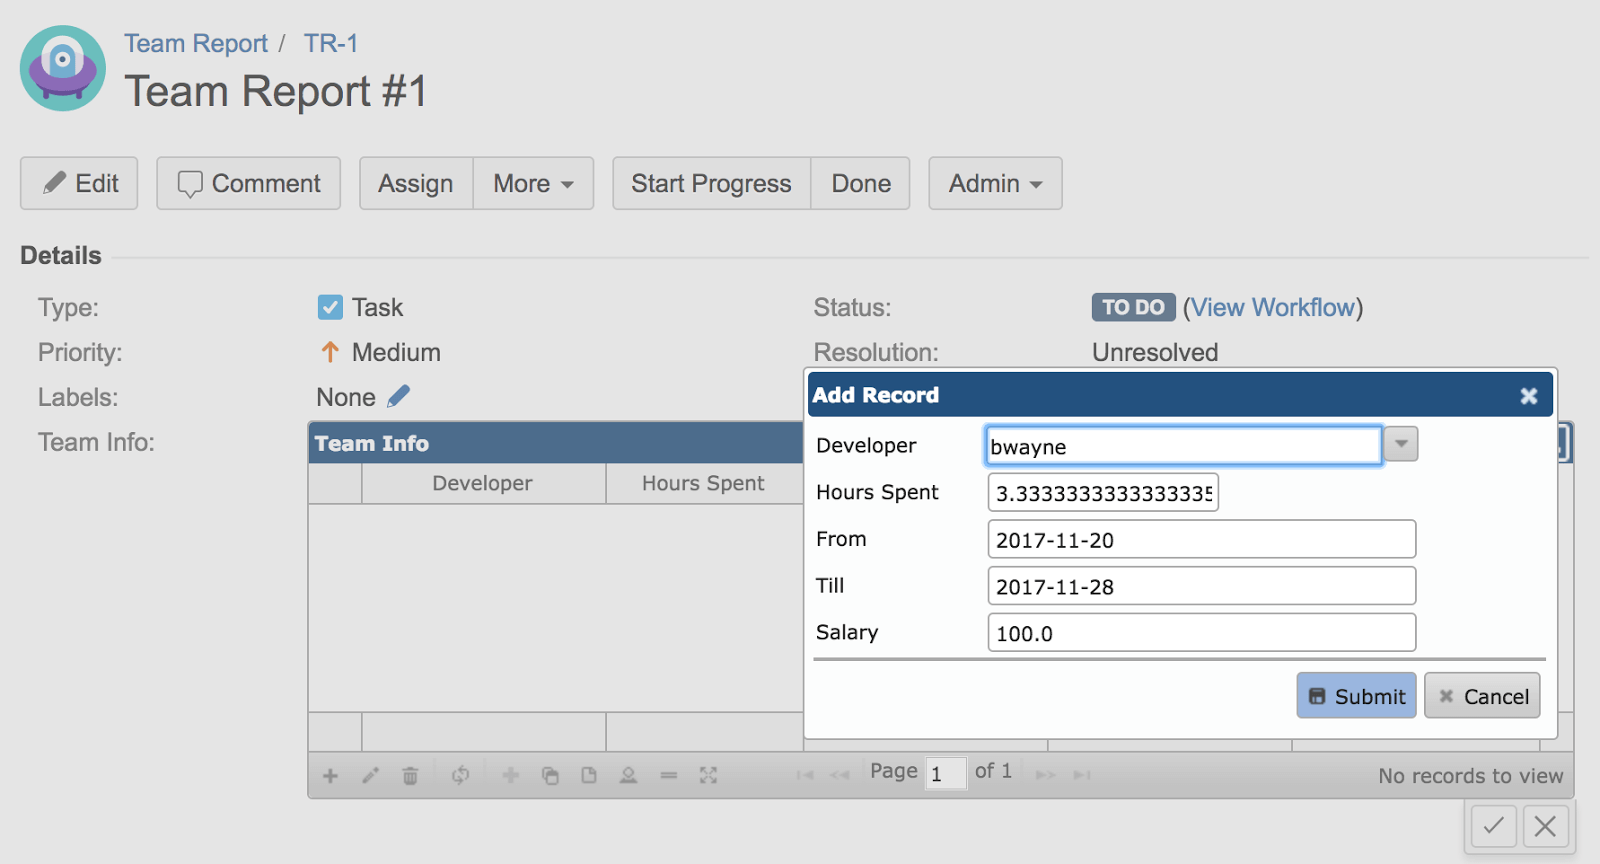
Now, we can create a Team Report issue and specify the developers with periods for the report.


Generate the reports
Time to report! For fancy reporting, we can set up the Xporter app. It allows you to create templates using Microsoft Word and Excel, RTF and TXT and these templates can be generated in Word, Excel, PDF, RTF and more formats. In our case, we are using a Single Issue export with a Word template. Our resulting document will be generated in RTF format
For more details on how Xporter works, please refer to the Xporter documentation.
The template looks like this:
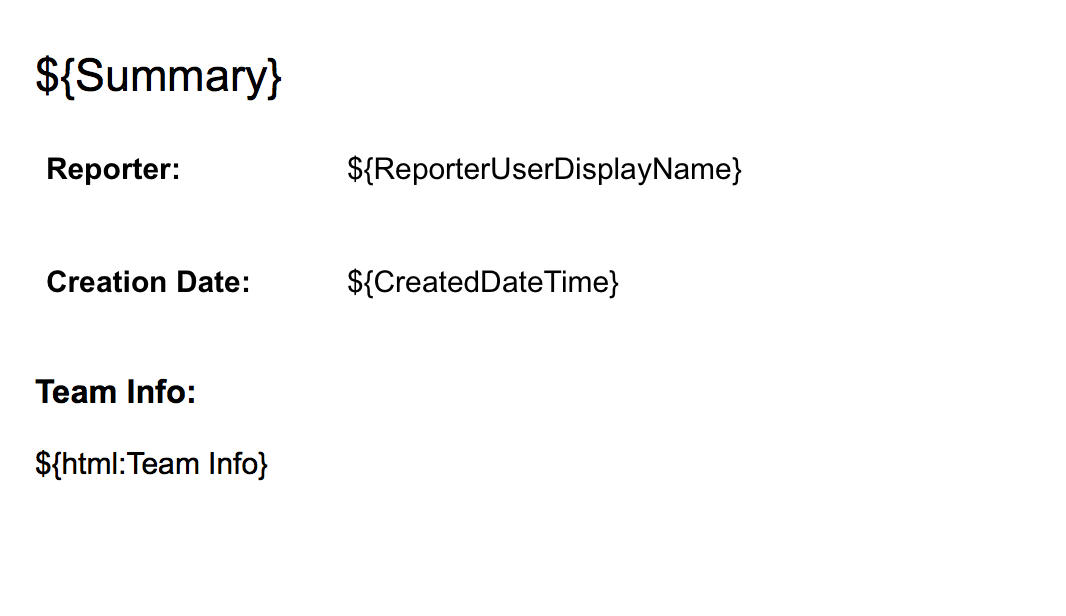
To print Issue fields using Xporter, you just need to put the field name in between ${…}. So, to print our custom field ‘Team Info’, we’ve defined ${html:Team Info}. Sometimes, we need to use a function to process the field’s data to get a better result. In this case, the Table Grid Field generated HTML content and we don’t want to see HTML tags in our final document. The html function will process the field’s data and the result will be the same viewed in the user browser.
Even though we selected the output as RTF, Docx and PDF are also available formats.
To be able to use this scheme, first we need to go to the Xporter templates page in the administration section. Click Add New Template, give it a name and upload your file.
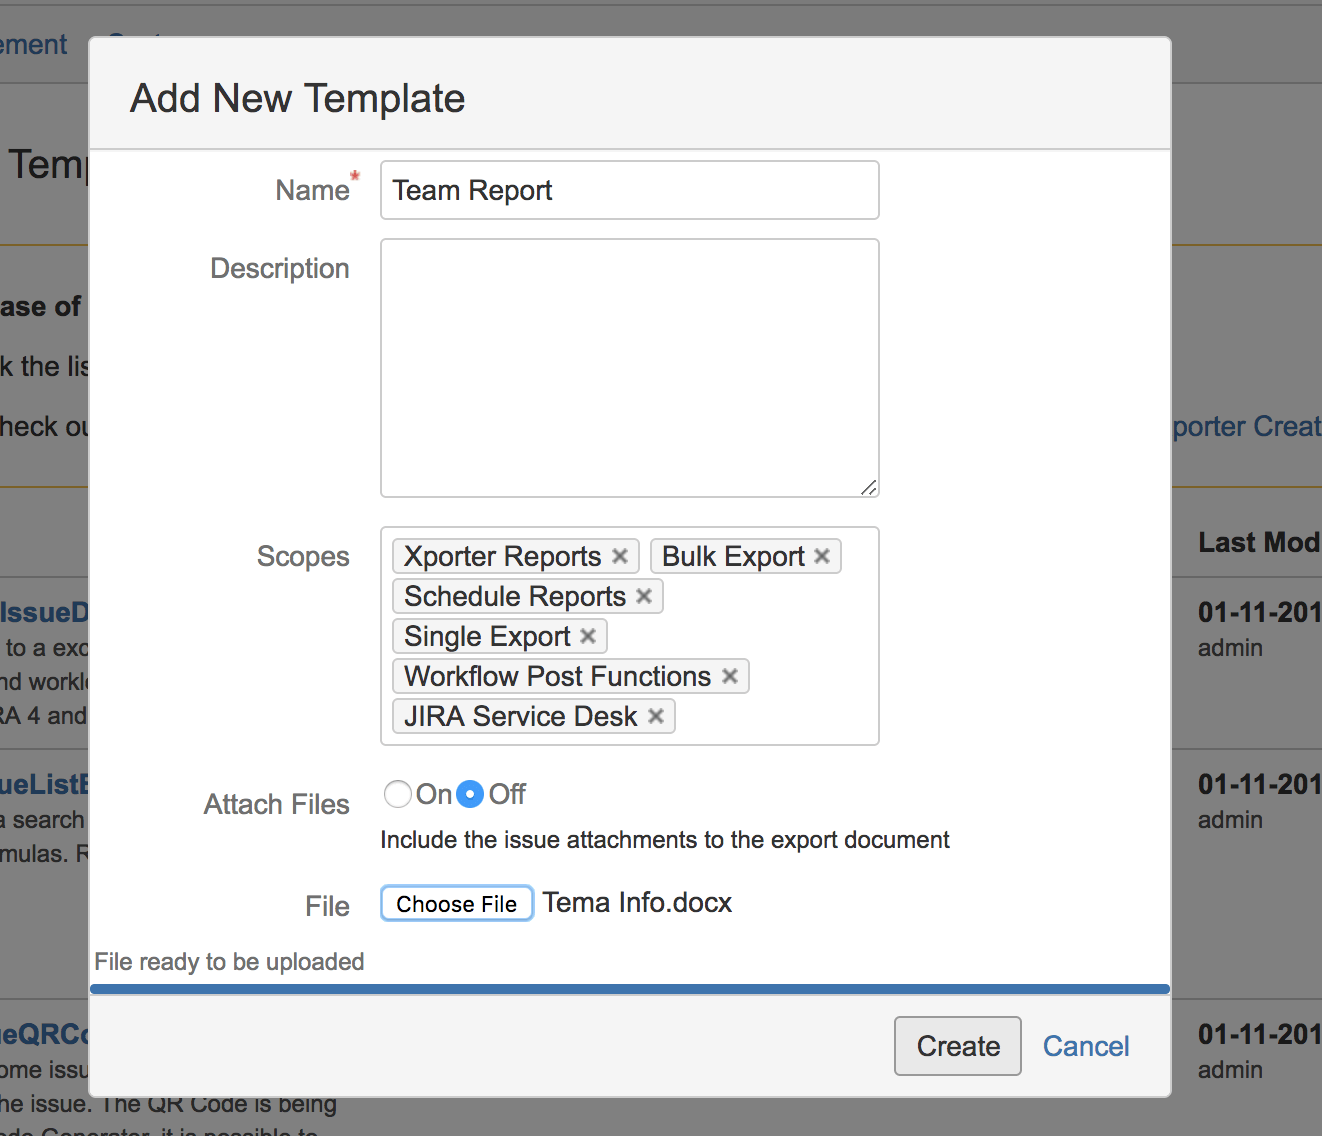
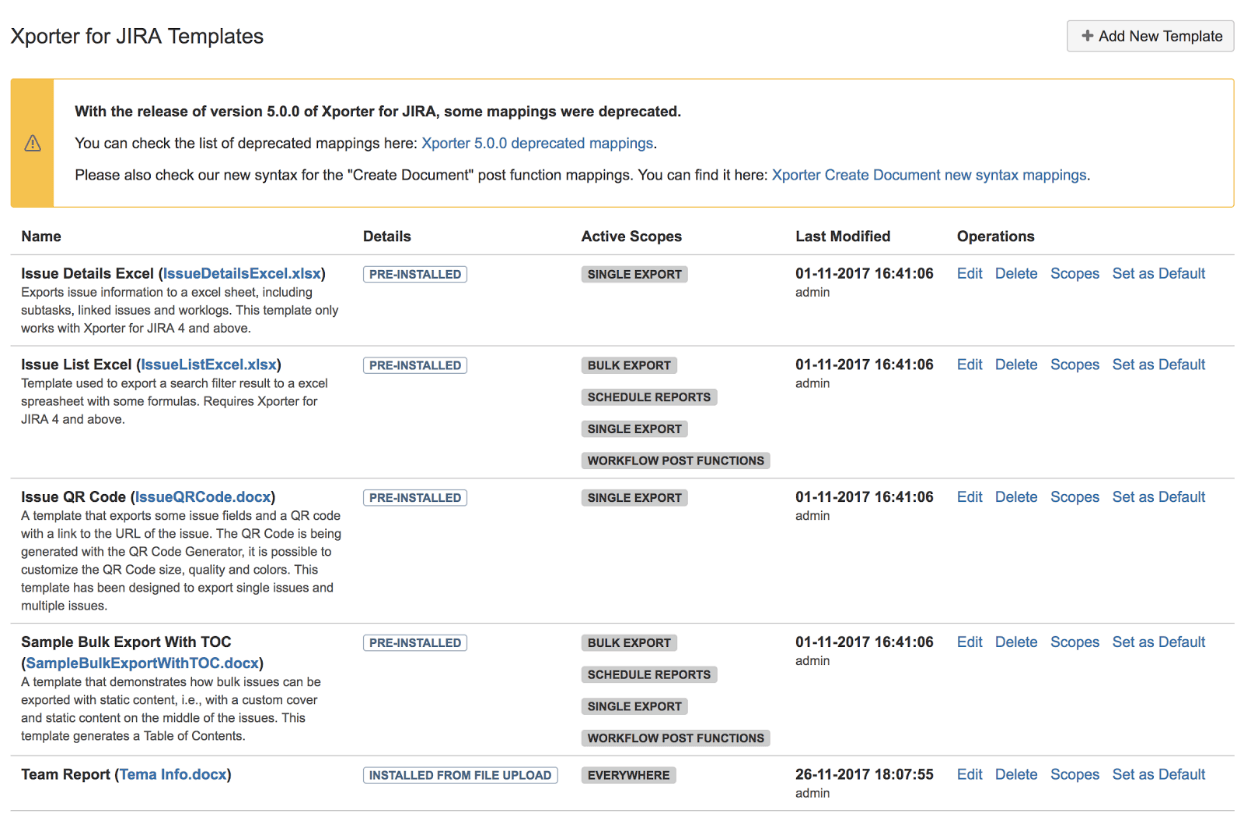
After this, the template is now available to be used. Xporter allows administrators to define where the template will be available to be used. It is available in Jira locations such as the Single Issue export, Bulk export, Workflow Post-Functions, Xporter Reports, Xporter scheduled reports, and Jira Service Desk (Customer Portal). Learn more here.
For this demo, we are going to export directly from the Issue view screen. We can select our ‘Team Report’ template from the drop-down. Let’s use the RTF format for our first report.
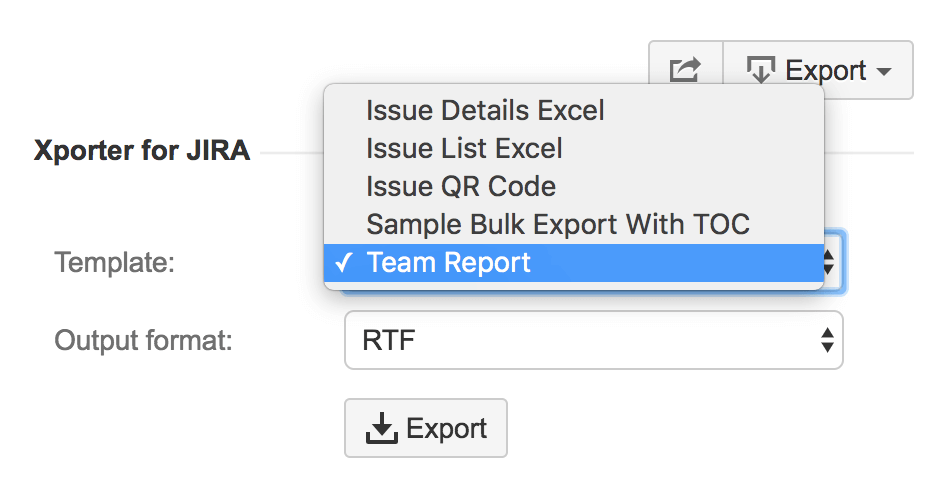
Click Export.
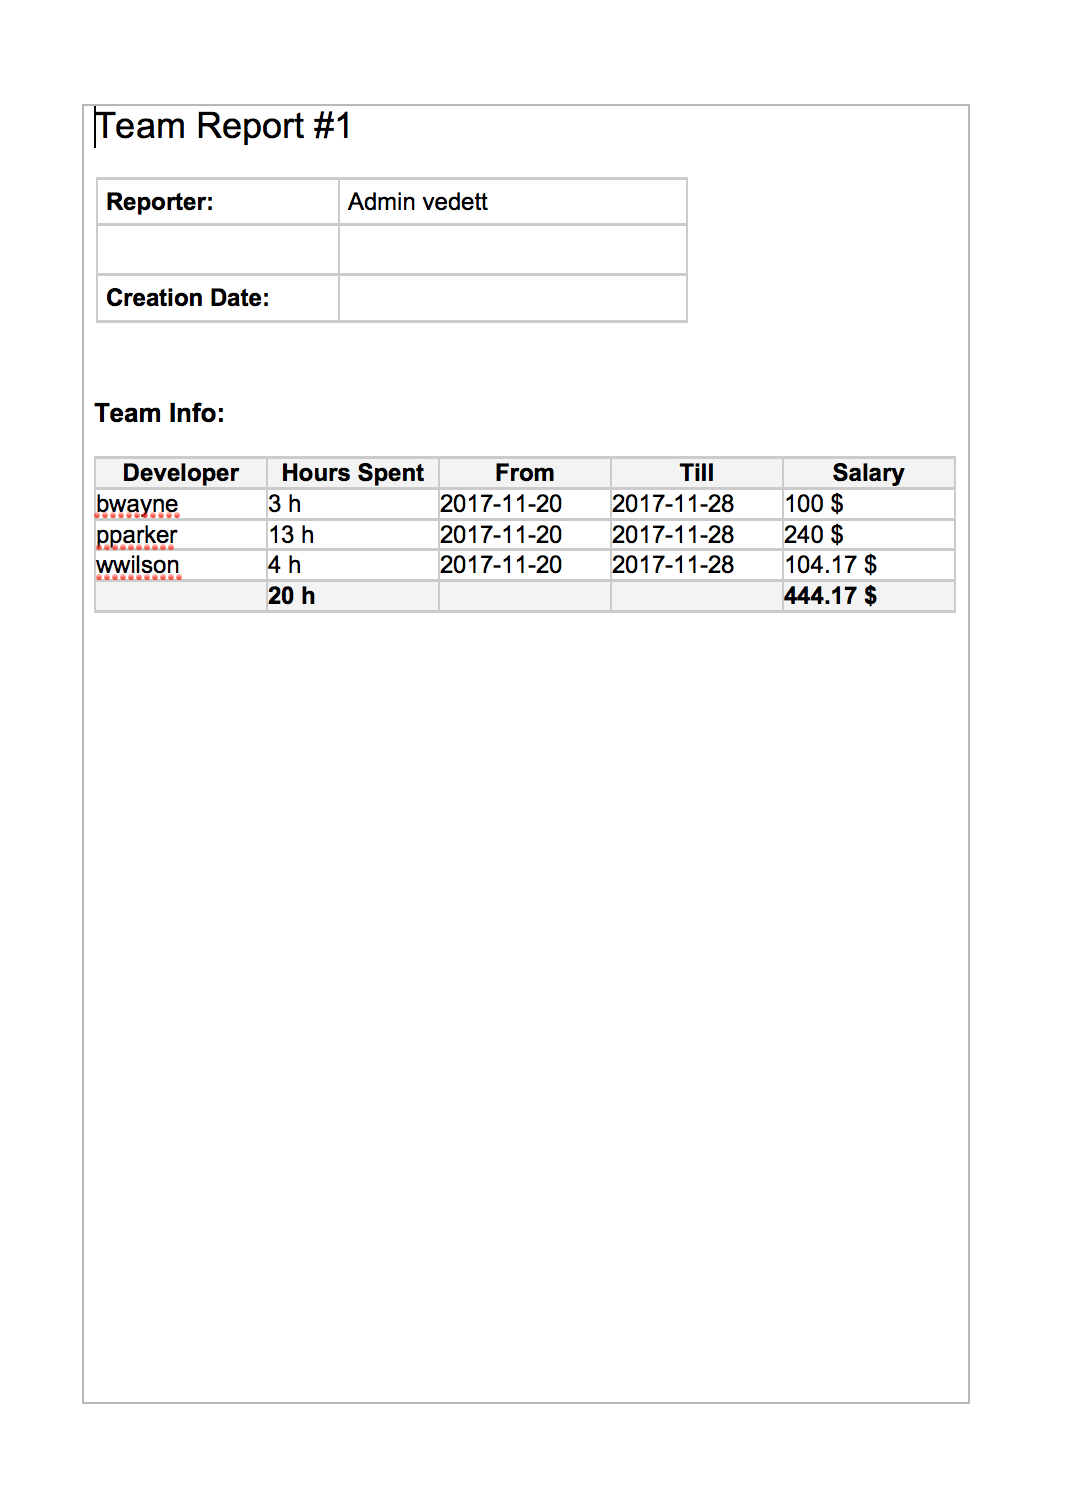
And there you go. Mission accomplished! The report has been generated successfully.
Additional features
In the example above, we got acquainted with a use case for our Table Grid Editor and Xporter app integration.
However, we’ve only covered a small fraction of the possibilities and features of these two apps. They both have a lot more to offer:
Table Grid Editor
- Datasource functionality where connection to a separate database might be defined and data from there might be used in your tables.
- Issue values placeholders to be used in formulas or SQL queries (issue id, assignee, etc.).
- Dynamic data from other custom fields.
- Table Grid Reader custom field which is read-only and filled in with SQL queries.
- Multi-Level Cascade custom field which has dynamic drop-downs populated with SQL queries and might have dependencies between them. It is compatible with Service Desk.
- Java and Rest APIs.
Xporter
- Exporting to PDF, XLSX, PNG, DOC, CSV and more.
- Exporting of other issue data such as linked issues, sub-tasks, comments, worklogs, attachments and more.
- Generating documentation based on multiple issues.
- Creating and sending documents via email to a file server.
- Post-functions to trigger export event on issue transitions.
For more details, please refer to the Xporter Documentation. If you have questions about the product, you can also contact the Xporter Support.
Conclusion
Although basic reporting is a functionality offered by Jira out of the box, it’s not very intuitive and only applicable to a limited range of use cases.
To make reporting more user-friendly, you can use the Xporter. If you integrate this with the Table Grid Editor, the possibilities expand. You’ll be able to report using spreadsheet-like structures.
In this blog post, we demonstrated this by generating team reporting per hourly rate. We showed you how to use the Table Grid Editor for adding tables to your issues. Afterwards, we exported these tables into beautiful templates ready to be sent out.
We hope you see how powerful this combination can be and how easy reporting can be.
Want to find out more on these Atlassian apps? Explore the Table Grid Editor here and the Xporter app right here.


